
Getting started
Open a sample storm drain model, run it on the EPA SWMM 5.2.4 engine, read the results and save your work, in about five minutes.
DrainPilot is a storm water and sewer modelling workspace that runs in your browser. It solves models with EPA SWMM 5.2.4 compiled to WebAssembly, the same engine as the desktop EPA SWMM program, and reads and writes standard SWMM .inp files. Nothing needs to be installed, and your files are not uploaded: the engine runs on your computer.
When DrainPilot opens it loads EPA SWMM Example 1, a small combined network in US units (CFS). The name of the open file is shown in the bar at the top, next to the project title.
Open a sample
Choose File > Start / Examples.... The Start window offers two ways to begin from nothing, and ten ready-made models:
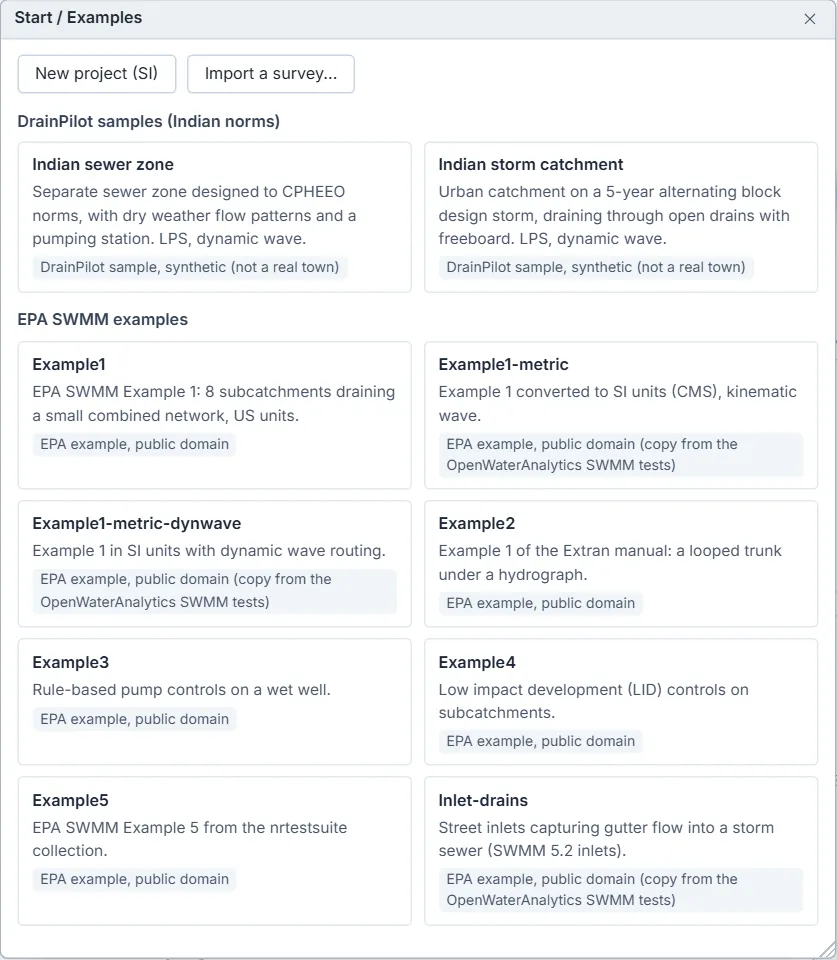
- New project (SI) starts an empty project in litres per second. See Building a network.
- Import a survey... builds a project from a manhole and pipe schedule, a DXF drawing or GIS layers. See Import and export.
- DrainPilot samples (Indian norms): Indian sewer zone, a separate sewer zone with dry weather flow and a pumping station, and Indian storm catchment, an urban catchment on a 5-year design storm draining through open drains. Both are synthetic, not real towns, and both are in LPS with dynamic wave routing.
- EPA SWMM examples: eight public domain models from EPA, including Example 1 in US and SI units, rule-based pump controls (Example3) and LID controls (Example4).
Click a card to open it. The same models are on the File > Open DrainPilot Sample and File > Open Example submenus.
- Choose File > Start / Examples...
- Click Indian storm catchment. The map shows 13 subcatchments, 13 junctions, the drains joining them and one outfall.
Run the simulation
Click Run on the toolbar, press F5, or choose Project > Run Simulation. The Run Status box shows Running SWMM... with a progress bar and the percentage done, and a Cancel button. When the run ends it reports one of:
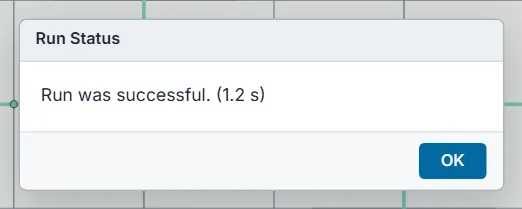
- Run was successful. with the time the run took. Press OK.
- Run was successful, with warning messages. See the Status Report. The results exist but need checking. Press Status Report, or see Fixing problems.
- Run was unsuccessful. followed by SWMM's reason. The Status Report opens by itself.
- Run was not started. The model reads a rain or other data file that is not attached yet. See Running a simulation.
Read the results
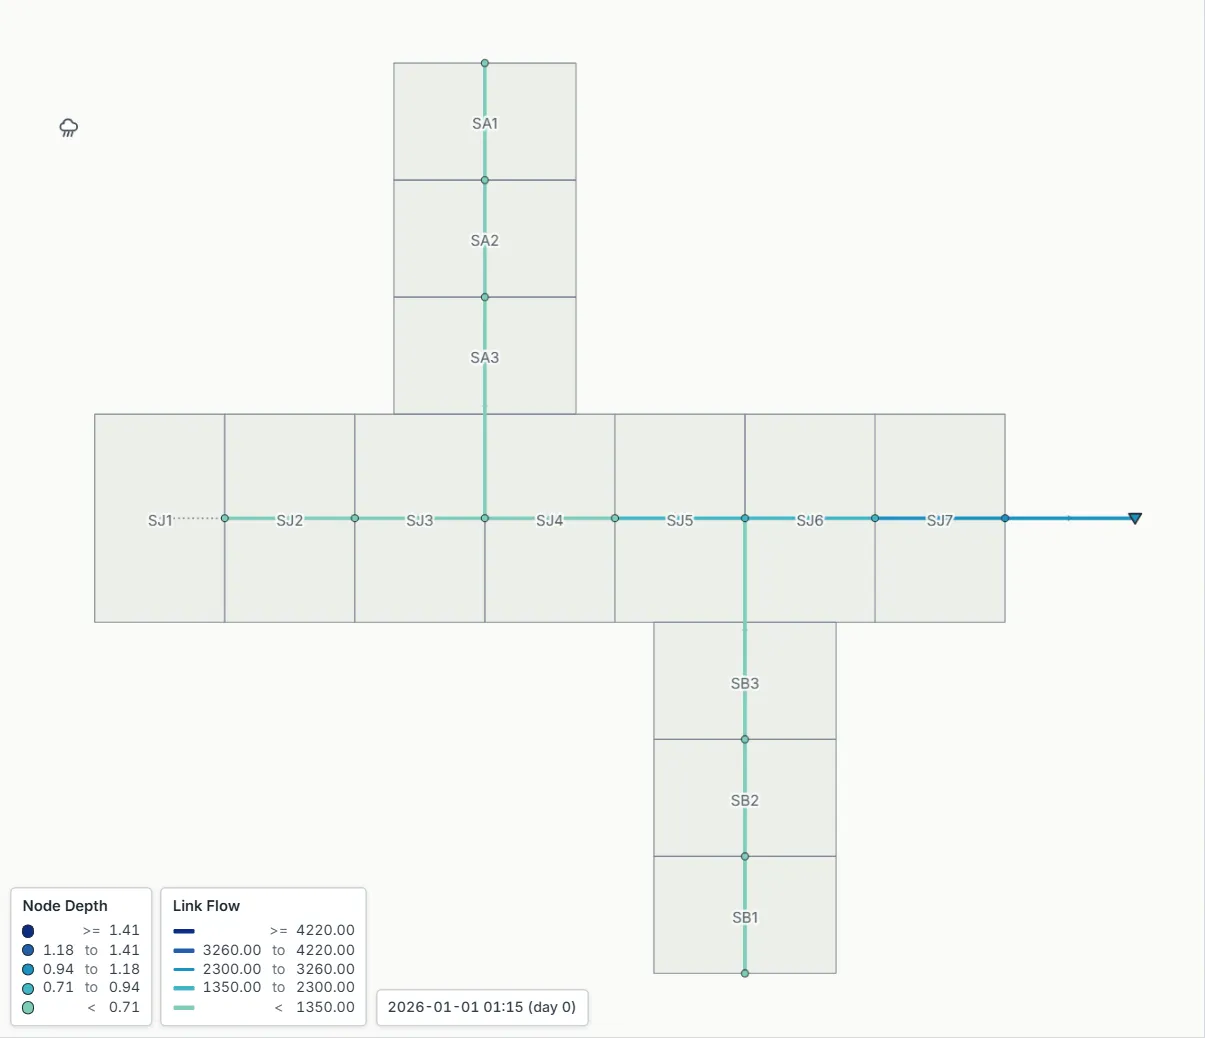
- After the first run of a model whose map is not coloured yet, DrainPilot colours nodes by Depth and links by Flow. The legend boxes at the bottom left of the map show what each colour means, with the reporting period beside them.
- Click a junction or a drain to see its properties in the Property Editor on the right. Results for the current reporting period are in the grey rows under RESULTS at the bottom.
- The Map tab of the Project Browser chooses what the map is coloured by and which reporting period it shows, and plays the run as an animation.
- For graphs, the profile plot, the animation window and map queries, see Viewing results.
- To check the drains against the CPHEEO storm water manual, use Design > Storm Compliance (SWM)..., described in Storm drain compliance.
The status bar at the bottom shows Results current after a good run. As soon as you edit anything it changes to Results out of date; run again to bring the results up to date.
Save your work
File > Save (Ctrl+S) downloads the project as an .inp file, named after the open file. File > Open... (Ctrl+O) opens an .inp file from DrainPilot, from EPA SWMM or from any program that writes the SWMM 5 format. The file you download is your copy of the model, so save often.
Where next
- The workspace: every menu, toolbar and panel.
- Building a network: draw rain gages, subcatchments, manholes and drains.
- Rainfall and design storms: rain time series and an IDF design storm.
- Sewer compliance and Sewer auto-design and pumping stations: CPHEEO sewer design.