
Running a simulation
Set the simulation options, attach rainfall and other data files, run SWMM with progress and cancel, and read the status report and continuity errors.
Simulation options
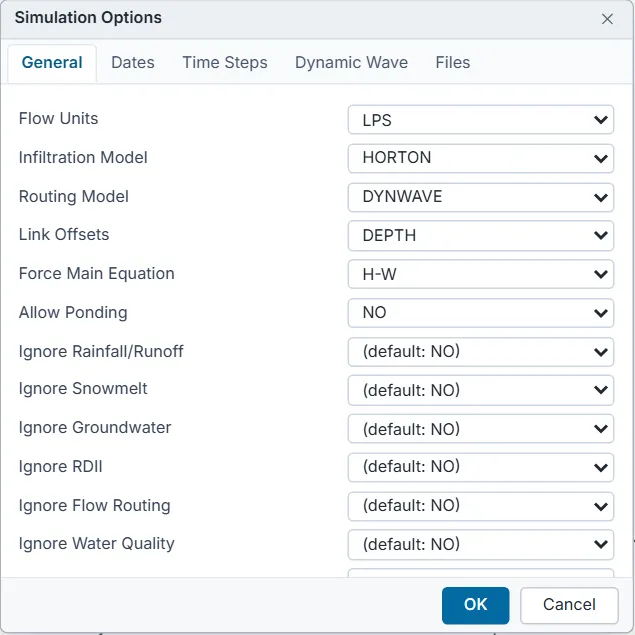
Project > Simulation Options... (or the Simulation Options toolbar button) opens SWMM's options in five tabs. Each list has a default: ... entry and each text box shows the default in grey: leave a field on its default and SWMM's own default applies. Press OK to apply the changes as one edit.
| Tab | Options |
|---|---|
| General | Flow Units (CFS, GPM, MGD, CMS, LPS, MLD), Infiltration Model, Routing Model (STEADY, KINWAVE, DYNWAVE), Link Offsets (DEPTH or ELEVATION), Force Main Equation (H-W or D-W), Allow Ponding, the Ignore switches for rainfall, snowmelt, groundwater, RDII, routing and quality, and Minimum Conduit Slope (%). |
| Dates | Start of the analysis, start of reporting and end of the analysis (date MM/DD/YYYY and time HH:MM:SS), street sweeping dates, antecedent dry days. |
| Time Steps | Reporting Step, runoff Dry Weather and Wet Weather steps, Routing step in seconds, Control Rule Step, Skip Steady Flow Periods, system and lateral flow tolerances. |
| Dynamic Wave | Inertial Terms, Normal Flow Criterion, Surcharge Method (EXTRAN or SLOT), Variable Time Step (safety factor), Conduit Lengthening Step, Minimum Nodal Surface Area, Maximum Trials per Step, Head Convergence Tolerance, Minimum Variable Step, Number of Threads. |
| Files | The [FILES] lines as text, for example USE RAINFALL "rain.dat" or SAVE HOTSTART "run.hsf". |
Attach rainfall and other data files
Some models read files from disk: a rain gage with a FILE data source, a time series stored in an external file, a temperature file, or a USE line in [FILES]. A web page cannot read your disk by itself, so you give DrainPilot those files:

- When a model needs files that are not attached, a yellow banner at the top of the map names each one and what reads it. Press Attach... on the banner, or choose File > Attach Data Files..., and pick the files.
- Or pick the .inp file and its data files together in File > Open...: the .inp opens and the other files are attached to it.
Files are matched by name, so the attached file must have the name the model gives (any folder in the model's path is ignored). Attaching a file with the same name again replaces the earlier one. Attached files stay with the open project in this tab only: they are not stored in the .inp, so attach them again after opening the project anew.
If you run with a file missing, the run does not start and the Run Status box says Run was not started. and names the files.
Run, watch progress, cancel
- Click Run on the toolbar, press F5, or choose Project > Run Simulation.
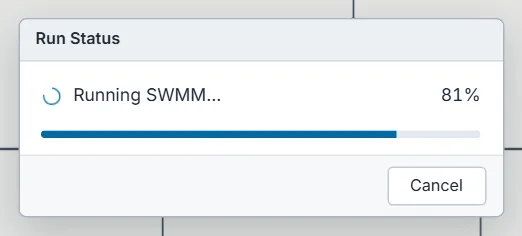
- The Run Status box shows Running SWMM..., a progress bar and the percentage of the simulation done. The status bar shows Running....
- To stop, press Cancel. The run stops, and the project and any earlier results stay exactly as they were; the box says Run was cancelled..
- When the run ends, read the message and press OK, or Status Report when it offers one.
SWMM runs on your computer in the browser, in the background, so the page stays responsive during long runs. One simulation runs at a time; tools that run SWMM themselves (calibration, scenarios, the sewer initial stage) queue behind it.
| Message | What it means |
|---|---|
| Run was successful. (n s) | SWMM finished with no warnings. The status bar shows Results current. |
| Run was successful, with warning messages. See the Status Report. | Results exist, but SWMM raised warnings. Read them in the Status Report or the Problems window. |
| Run was unsuccessful. followed by the reason | SWMM stopped, usually on an input error. The Status Report opens with SWMM's message. If an earlier run's results exist they stay, marked Results out of date; otherwise the status bar shows Run failed. |
| Run was cancelled. | You pressed Cancel. |
| Run was not started. | A data file the model reads is not attached. |
The status report
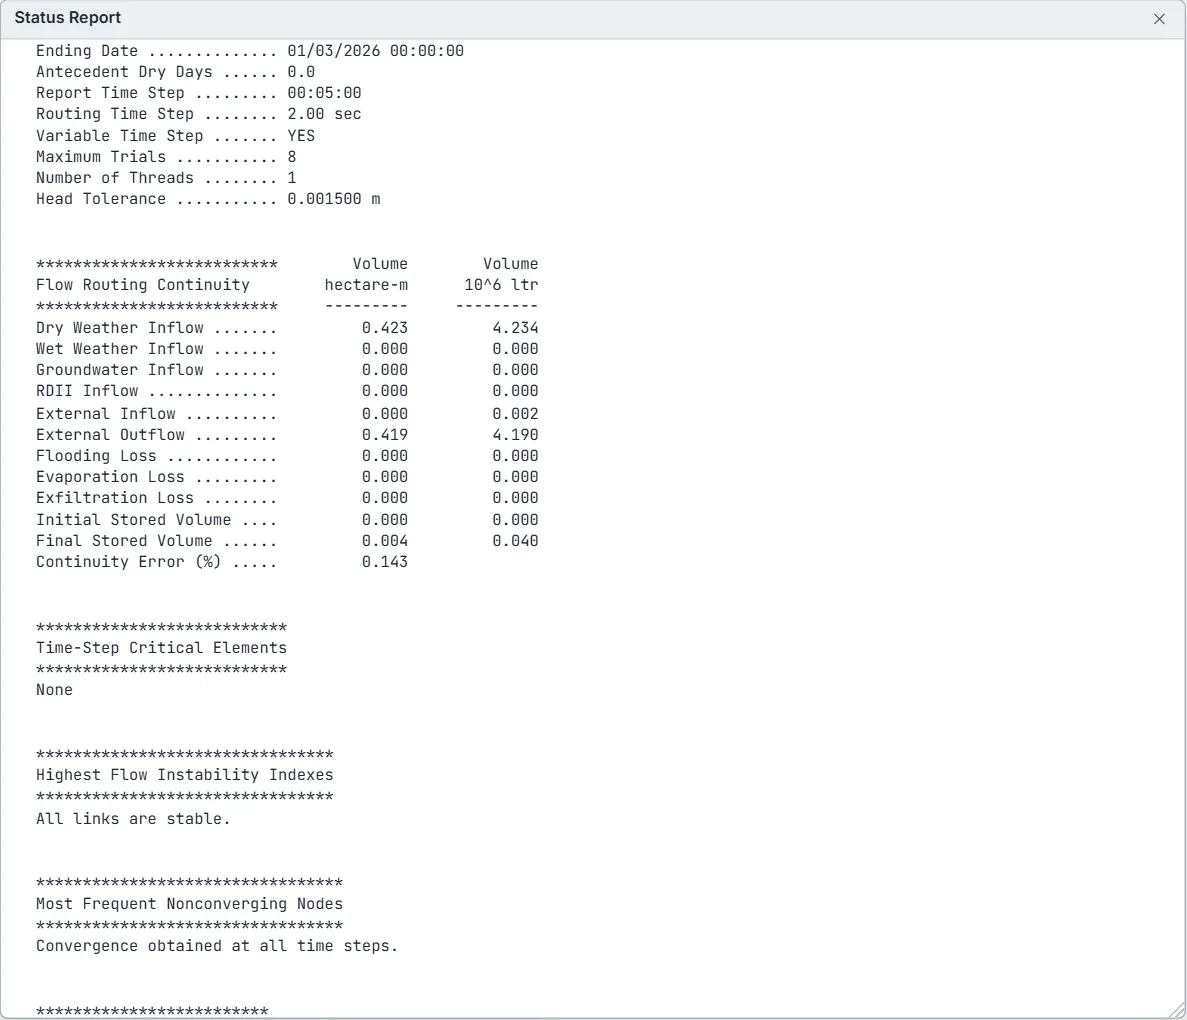
Report > Status (or the Status Report toolbar button) shows SWMM's report file of the last run as text, as SWMM writes it: for example the analysis options, the continuity tables, the highest continuity errors, and the summary tables for subcatchment runoff, node depth, node flooding and surcharge, outfall loading and link flow. Before any run it shows the warnings from opening the file, or No run yet.. To keep the report, use File > Export Results and its Status Report (.rpt) item.
Continuity errors
SWMM checks that the water going in equals the water coming out plus the water stored, for runoff and for flow routing, and prints the difference as a percentage in the Runoff Quantity Continuity and Flow Routing Continuity tables of the status report. DrainPilot's Problems window reads those numbers and grades them:
| Continuity error | Grade in the Problems window |
|---|---|
| Up to 1 % | Not listed: good. |
| Over 1 % up to 5 % | Warning: usable for checking, but improve it before you report results. |
| Over 5 % | Error: the results are not reliable enough for a DPR; peak flows and flood volumes may be wrong. |
These limits are DrainPilot's own choice for DPR work, not SWMM's. For a large flow routing error, shorten the routing step (5 to 30 s for dynamic wave) and turn on the variable time step, lengthen or merge very short conduits next to long ones, and look for sudden large changes in pipe size or level. For a large runoff error, shorten the wet weather step to the rainfall interval or less and check for extreme subcatchment widths and slopes. See Fixing problems.