
Rainfall and design storms
Give subcatchments rain: rain gages, rainfall time series and data files, and a design storm built from your city's IDF curve by the alternating block method.
In SWMM, rain reaches a subcatchment only through its rain gage. Every subcatchment names one gage in its Rain Gage property, and every gage takes its rainfall from a time series in the project or from an external rainfall file.
Rain gages
Add one with Add Rain Gage and a click on the map, then set its properties:
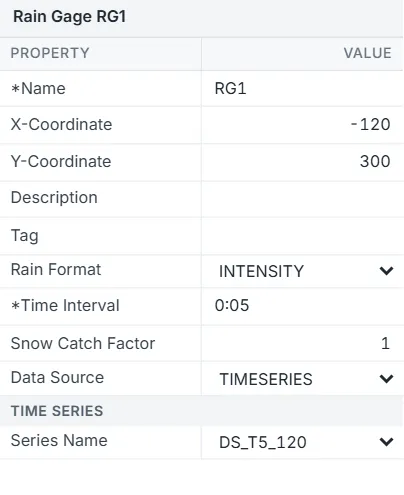
| Property | Meaning |
|---|---|
| Rain Format | INTENSITY (rate, mm/hr or in/hr), VOLUME (depth in each interval) or CUMULATIVE (depth since the start). |
| Time Interval | The recording interval of the data, for example 0:05 for five minutes. Required. |
| Snow Catch Factor | A correction for snow gauges; leave it at 1 for rain. |
| Data Source | TIMESERIES (then pick the Series Name) or FILE (then type the File Name, Station ID and Rain Units IN or MM). |
A new gage uses INTENSITY, a 1:00 interval and the project's first time series. A new subcatchment is given the project's first rain gage; change it in its Rain Gage property.
Rainfall time series
To open an existing series, click Time Series in the Browser and double-click the series. To start a new one, choose Tools > Time Series Editor (new). The editor has:
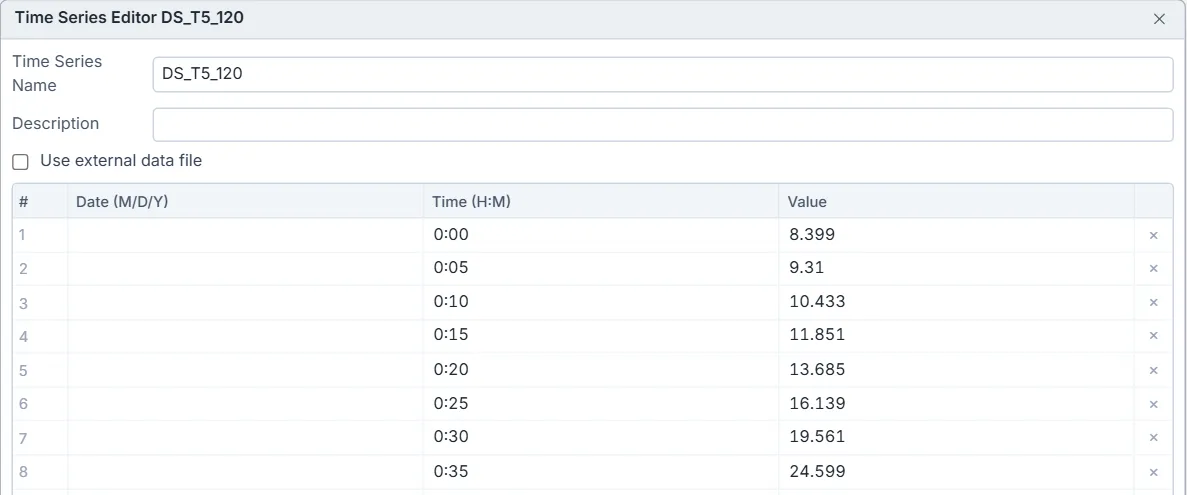
- Time Series Name and Description.
- A grid of Date (M/D/Y), Time (H:M) and Value. The date may be left blank, in which case times count from the start of the simulation. Each row needs a time and a number.
- A plot of the series in hours under the grid, which updates as you type.
- Use external data file: tick it and type a File Name to read the series from a file instead.
Press OK to save the series as one undo step, or Cancel to leave it as it was.
Rainfall from a data file
A rain gage with Data Source FILE, or a time series that uses an external file, reads that file when the simulation runs. A browser cannot open files on your disk by itself, so attach the file with File > Attach Data Files... before you run. See Running a simulation.
Build a design storm from an IDF curve
Design > Design Storm / IDF... opens the Storm Drain Compliance window on its Design storm tab. It builds a SWMM rainfall series from your intensity-duration-frequency (IDF) relation by the alternating block method, so a dynamic SWMM run feels the same storm the rational method design uses.
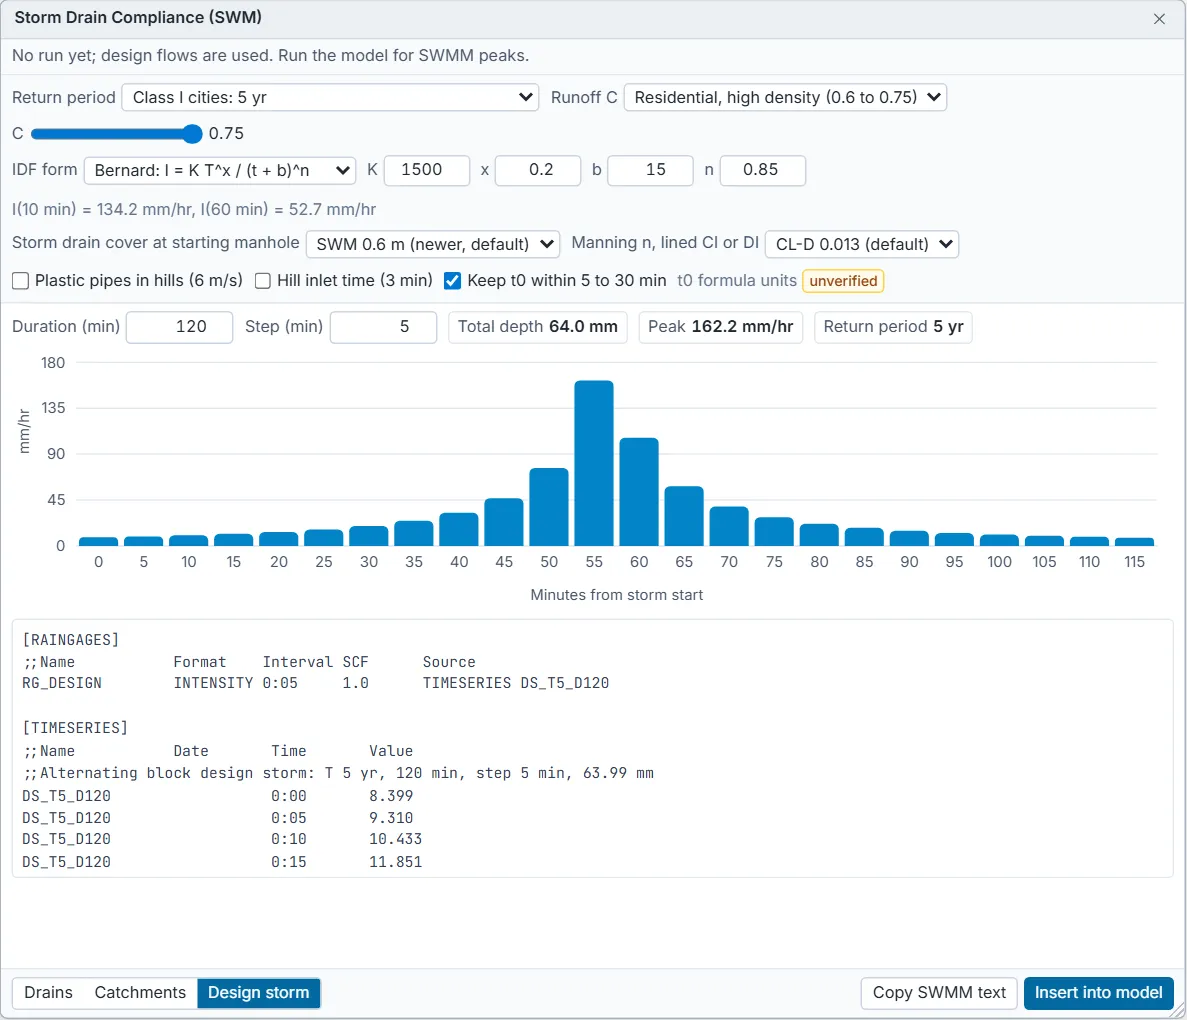
- Choose the Return period for the town (see the table below).
- Choose the IDF form and type its coefficients for your city. The window shows the intensity at 10 and 60 minutes as you type, so you can check them against your IDF table.
- On the Design storm tab, set Duration (min) (120 to start) and Step (min) (5 to start).
- Read the Total depth and Peak chips and the bar chart of the storm. The SWMM text in chip says which units the SWMM lines are written in: mm/hr for an SI model, in/hr for a US one.
- Press Insert into model to add the storm to the project, or Copy SWMM text to copy the [RAINGAGES] and [TIMESERIES] lines to the clipboard.
| IDF form | Notes |
|---|---|
| Talbot: I = a / (t + b) | Coefficients for the chosen return period. |
| Sherman: I = a / (t + b)^n | Coefficients for the chosen return period. |
| Bernard: I = K T^x / (t + b)^n | One relation for every return period T. |
| Table of duration and intensity | Type one row per duration: minutes, then intensity in mm/hr, for the chosen return period. Values between rows are read on log scales. |
In every form I is in mm/hr and t in minutes.
SWMM reads a rain gage's time series in the model's own units: in/hr when Flow Units is CFS, GPM or MGD, and mm/hr when it is CMS, LPS or MLD. You always type the IDF in mm/hr, and the chart stays in mm/hr. For a US model the window divides the storm by 25.4 before it writes the SWMM lines, shows the inch values beside the mm ones in the Total depth and Peak chips, and says so in a note above the chart. A model with no FLOW_UNITS line counts as CFS, which is SWMM's default.
| Return period choice | Years | Source |
|---|---|---|
| Class I cities | 5 | SWM Table 4.1 p.52 |
| Other cities | 2 | SWM Table 4.1 p.52 |
| Airports and critical infrastructure (50 yr) | 50 | SWM Table 4.1 p.52 |
| Airports and critical infrastructure (100 yr) | 100 | SWM Table 4.1 p.52 |
For airports and critical infrastructure the table is recorded as 100/50 years without saying which applies to which, so DrainPilot offers both and leaves the choice to you.
What Insert into model does
- Adds a rain gage named RG_DESIGN (INTENSITY, interval equal to the step) and a time series named after the storm, for example DS_T5_D120 for a 5 year, 120 minute storm. A gage or series of the same name is replaced, so an older RG_DESIGN in VOLUME or CUMULATIVE format becomes INTENSITY to match the series.
- Writes the series in mm/hr for an SI model and in in/hr for a US model, as the SWMM text in chip shows. Copy SWMM text copies the same lines.
- Assigns RG_DESIGN to every subcatchment in the project, because subcatchments only feel a storm through their gage.
- Ends the series with a zero, so SWMM does not hold the last intensity after the storm.
- Counts as one edit: Edit > Undo takes it all back.
A note at the top of the window confirms what was inserted. Run the model to route the storm.
How the alternating block storm is built
For each multiple of the step up to the duration, the IDF gives the total depth for that duration. The depth added by each step is a block. The largest block goes in the middle of the storm and the rest alternate right and left of it, so every window centred on the peak holds the IDF depth for its own duration. The total depth equals the IDF intensity at the full duration times the duration.
If the duration is not a whole number of steps it is rounded, and the window says so. If your IDF gives less depth for a longer duration somewhere, the negative blocks are set to zero and the window warns that the total no longer matches.