Sewer compliance
The sewer capacity statement: every reach checked at initial and ultimate peak against the CPHEEO Manual on Sewerage and Sewage Treatment Systems (2013), from SWMM runs or design sewage flows.
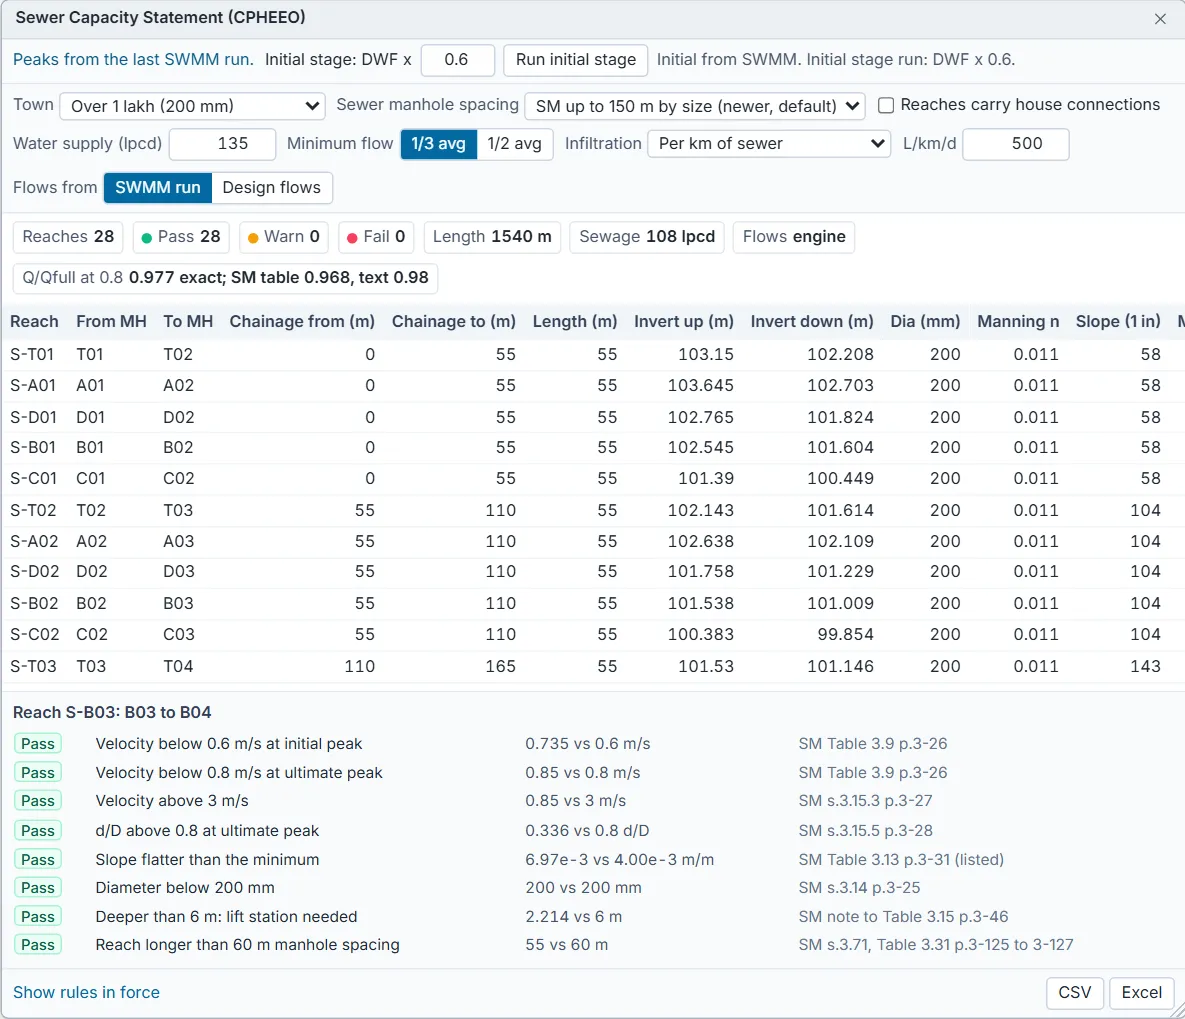
Design > Sewer Compliance (CPHEEO)... opens the Sewer Capacity Statement (CPHEEO) window. It lists every gravity sewer reach from the head of each line down, with chainage, levels, diameter, slope, flows, velocities and d/D at the initial and ultimate stage, a Pass, Warn or Fail verdict and the reasons, in the layout of a DPR statement. While it is open the map colours each reach by its verdict.
SM in DrainPilot is the CPHEEO Manual on Sewerage and Sewage Treatment Systems, Part A, 3rd edition, November 2013. CL-S is the MoUD Checklist for Submission and Scrutiny of DPR (Sewerage), March 2012.
Where the flows come from
- Ultimate stage. After a valid run, the peaks of the last SWMM run: the dry weather flow the model carries. The line at the top says Peaks from the last SWMM run.. Before a run, or when the run is out of date, the design flows below are used.
- Initial stage. When the model has dry weather flow, the top line shows Initial stage: DWF x with a share (0.6 to start) and a Run initial stage button. It runs SWMM again on a copy of the model with every dry weather flow scaled by the share. Until you press it, the initial stage uses design flows, and the Flows chip says mixed.
- Flows from switches between SWMM run and Design flows when a run exists.
A SWMM model holds no population, so DrainPilot recovers it. If manholes carry dry weather flow, each manhole's population is its DWF divided by the sewage rate of 108 lpcd (80 % of 135 lpcd supply), and the initial population is that times the share; this recovery uses 135 lpcd whatever the Water supply box says. If the model has no dry weather flow, the window asks for the town's population at the base, intermediate and ultimate year and spreads it over the manholes By sewer length or Equal per manhole.
Rising mains (conduits with a FORCE_MAIN section) are left out: the gravity checks do not apply to a pressure pipe.
Design sewage flows
- Sewage is 80 % of the water supply (CL-S 4.3(a) p.10), but never less than 100 lpcd (SM s.3.5 p.3-3). The Water supply (lpcd) box starts at 135; the Sewage chip shows the rate used and says minimum when the 100 lpcd floor governs.
- The peak factor comes from the population upstream of each reach (SM Table 3.2 p.3-3): 3 up to 20,000, 2.5 up to 50,000, 2.25 up to 7,50,000, 2 above.
- Infiltration (SM s.3.6, Table 3.3 p.3-4): None, Per km of sewer (500 to 5000 L/km/d), Per hectare of area served (5000 to 50000 L/ha/d) or Per manhole (250 to 500 L/d). It starts at per km, 500 L/km/d. A rate outside the SM range is badged. The allowance is capped at 10 % of the peak sewage flow.
- The design flow of a reach is its peak sewage flow plus infiltration, at the base year population for the initial stage and the ultimate population for the ultimate stage. At a manhole with two outgoing sewers the flow is split equally.
- Minimum flow (1/3 or 1/2 of the average flow, SM s.3.5 p.3-4) is worked out with the design flows, but no check or column of the statement uses it yet, so changing it does not change the statement.
- Depth and velocity at a design flow are Manning normal flow in the pipe.
The checks
A reach's verdict is its worst check. Click a row to see every check on it with the value, the limit, the source clause and whether the limit is verified.
| Check | Limit | Verdict if breached | Source |
|---|---|---|---|
| Velocity below 0.6 m/s at initial peak | 0.6 m/s | Fail | SM Table 3.9 p.3-26 |
| Velocity below 0.8 m/s at ultimate peak | 0.8 m/s | Fail | SM Table 3.9 p.3-26 |
| Velocity above 3 m/s, at either stage | 3 m/s | Fail | SM s.3.15.3 p.3-27 |
| d/D above 0.8 at ultimate peak (Surcharged at ultimate peak when the pipe runs full); circular pipes only | 0.8 d/D | Fail | SM s.3.15.5 p.3-28 |
| Slope flatter than the minimum (or Flat or adverse slope); the table applies to circular pipes | See the minimum slope table | Fail | SM Table 3.13 p.3-31 |
| Diameter below the minimum for the town; circular pipes only | See the town choices | Fail | SM s.3.14 p.3-25 |
| Cover under 1 m at starting manhole | 1 m | Fail | SM s.3.20.3 p.3-41 |
| Deeper than 6 m: lift station needed (ground to invert at either end) | 6 m | Warn | SM note to Table 3.15 p.3-46 |
| Reach longer than the manhole spacing | See the spacing choices | Fail | SM s.3.71, Table 3.31 p.3-125 to 3-127, or SM s.3.71 p.3-125, or CL-S |
| Outgoing crown above incoming crown on change of size | Crowns matched | Warn | SM s.3.20.3 p.3-42 |
Minimum slope (SM Table 3.13 p.3-31), as 1 in N:
| Diameter | Minimum slope |
|---|---|
| 150 mm | 1 in 170 |
| 200 mm | 1 in 250 |
| 250 mm | 1 in 360 |
| 300 mm | 1 in 450 |
| 375 mm | 1 in 670 |
| 450 mm | 1 in 830 |
| 525 mm or more | 1 in 1000 |
Between listed sizes the next smaller listed size's slope applies, the steeper of the two, so an odd size is never allowed flatter than a standard size just below it. That rule is DrainPilot's reading of the table and is badged unverified, as is the 1 in 170 applied below 150 mm.
| Town choice | Minimum diameter | Source |
|---|---|---|
| Over 1 lakh (200 mm) | 200 mm | SM s.3.14 p.3-25 |
| Over 1 lakh, 150 mm allowed | 150 mm | SM s.3.14 p.3-25 |
| Under 1 lakh or hills (150 mm) | 150 mm | SM s.3.14 p.3-25 |
Manhole spacing. SM (2013) is newer than CL-S (2012). The Sewer manhole spacing choice is SM up to 150 m by size (the default) or CL-S up to 300 m. Ticking Reaches carry house connections applies 30 m (SM s.3.71 p.3-125) to every reach under the SM choice.
| Diameter (SM spacing) | Maximum spacing | Status |
|---|---|---|
| Up to 600 mm | 60 m | Verified |
| Over 600 up to 900 mm | 90 m | Verified |
| Over 900 up to 1200 mm | 120 m | Verified |
| Over 1200 up to 1500 mm | 150 m | Verified |
| Over 1500 mm | 150 m | Unverified: Above 1500 mm SM gives no value in the file; 150 m is carried over. |
Q/Qfull at d/D 0.8. The chip shows three figures for reference: the exact circular-pipe value DrainPilot computes with, SM Table 3.12: 0.968, and SM text: 0.98. Shown for reference only: the checker computes d/D from exact circular geometry (0.977 at 0.8).
Cover is ground minus the pipe crown at the starting manhole of a line. A SWMM model has no separate ground level, so ground is the manhole rim: invert plus maximum depth.
Rules in force and export
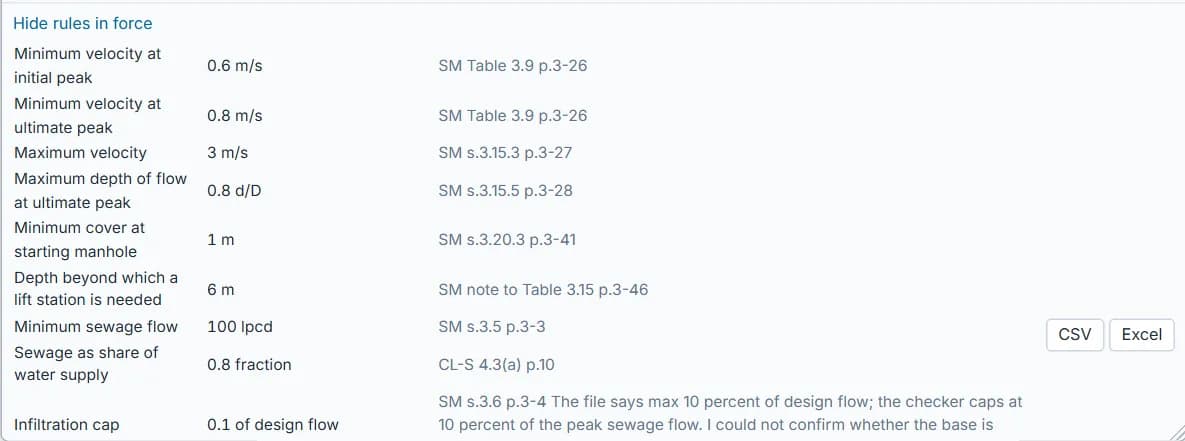
Show rules in force at the bottom lists every limit applied, with its value, unit and clause, including the peak factor bands. CSV and Excel export the statement exactly as the table shows it; the Excel file adds a Summary sheet with the counts, the sewage rate, the flow source, the Q/Qfull figures and the spacing basis.