
Viewing results
Colour the map by any result, step and animate through the run, plot time series and the profile of a sewer, query the map, and find SWMM's summary tables.
Colour the map
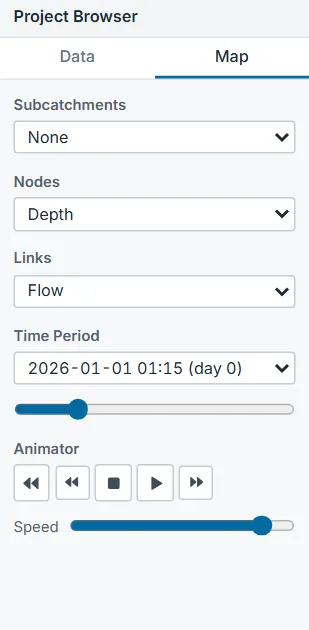
The Map tab of the Project Browser has one list each for Subcatchments, Nodes and Links. Pick a variable and the map colours those objects by it, with a legend at the bottom left. Variables marked * are computed by a run and colour nothing until you run.
| Objects | Input values | Computed by a run |
|---|---|---|
| Subcatchments | Area, Width, % Slope, % Imperv | Rainfall, Snow Depth, Evaporation, Infiltration, Runoff, GW Flow, GW Elev., Soil Moisture |
| Nodes | Invert | Depth, Head, Volume, Lateral Inflow, Total Inflow, Flooding |
| Links | Max. Depth, Roughness, Slope | Flow, Depth, Velocity, Volume, Area Filled, d/D |
Area Filled is SWMM's link capacity output: the filled share of the cross-section area. d/D is the flow depth over the full height. They differ: a circular pipe at d/D 0.8 is about 86 % filled by area.
After the first run of a model whose map is not coloured, DrainPilot picks node Depth and link Flow for you. View > Values writes each object's value beside it on the map.
Step through the run
The Time Period list and the slider under it on the Map tab choose the reporting period shown on the map and in the Property Editor's result rows. The Animator buttons rewind, step back one period, stop, play and step forward one period, and the Speed slider sets how fast it plays. The date and time of the period shown is printed beside the map legend.
The Results Animation window
Report > Results Animation is a fuller animator with engineering views. While it is open it colours the map with its own choices, over the Map tab's.
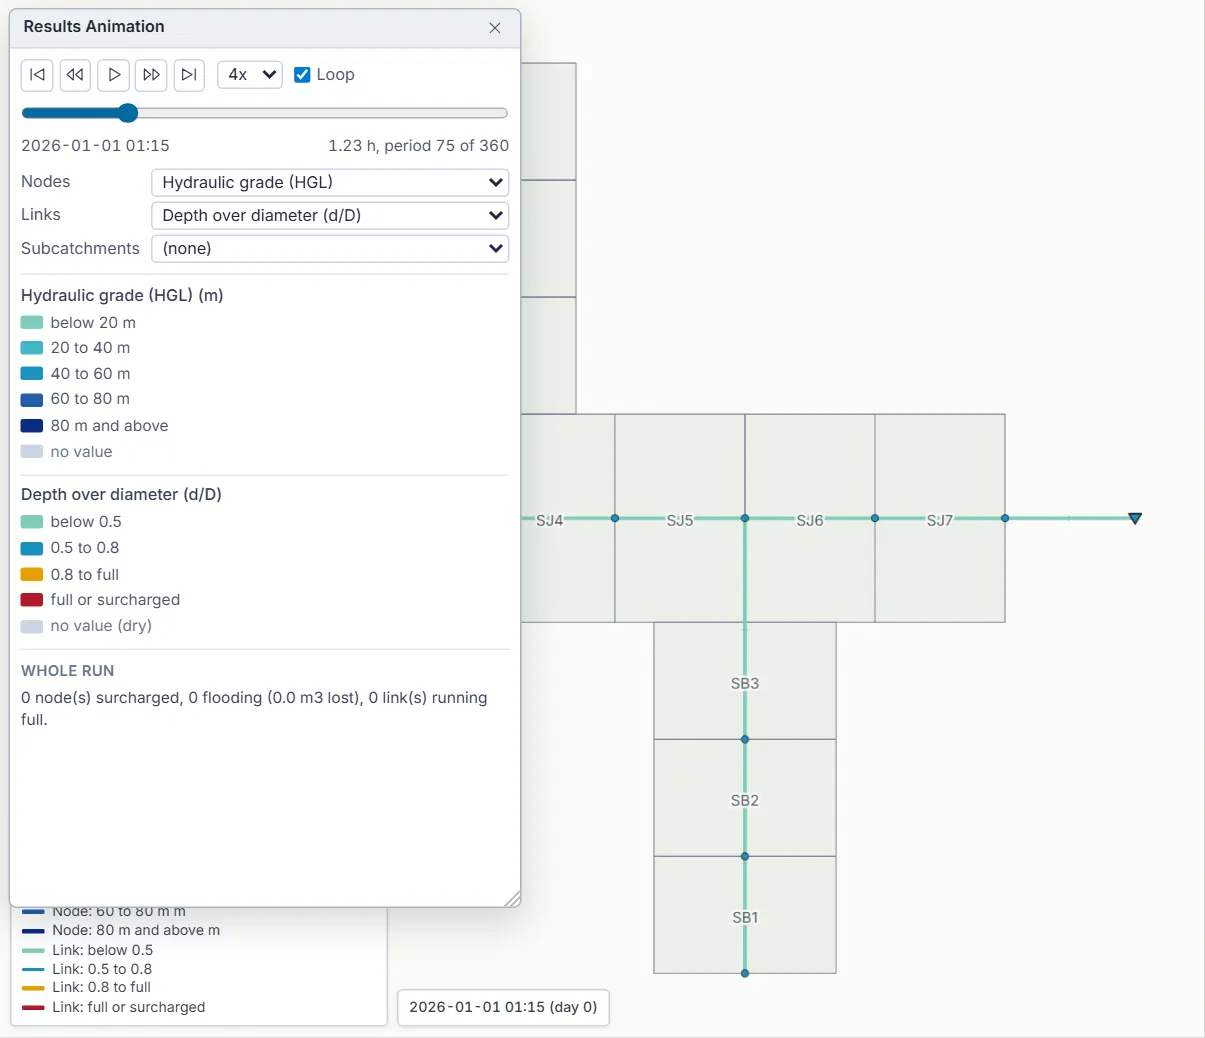
- Buttons for first period, previous period, play or pause, next period and last period; a speed of 1x, 2x, 4x, 8x, 16x reporting periods per second; Loop to repeat; a slider, and the date, elapsed hours and period number.
- Nodes: Node depth, Hydraulic grade (HGL), HGL above crown, Flooding rate, Flood volume so far, Total inflow, or Flood risk. HGL above crown and Flood risk need node levels and are hidden when the model has none.
- Links: Flow, Depth over diameter (d/D), Area filled (SWMM capacity), Velocity, Flow depth.
- Subcatchments: Runoff, Rainfall, Infiltration.
- A legend for each layer shown, and a Whole run line: how many nodes surcharged, how many flooded and the volume lost, and how many links ran full.
- A table of the nodes at risk, worst first, with their risk class, the highest HGL above the crown and the flood volume. Click a row to centre the map on that node.
The flood risk classes are: Below crown, Surcharged, HGL within 0.3 m of ground, Flooding below 100 m3, and Flooding 100 m3 or more.
Time series graphs
Report > Time Series Plot... (or the Time Series Plot toolbar button) plots one result over the whole run, against elapsed hours from the simulation start, with a dashed line at the reporting period shown on the map. It opens on the selected object. Choose:
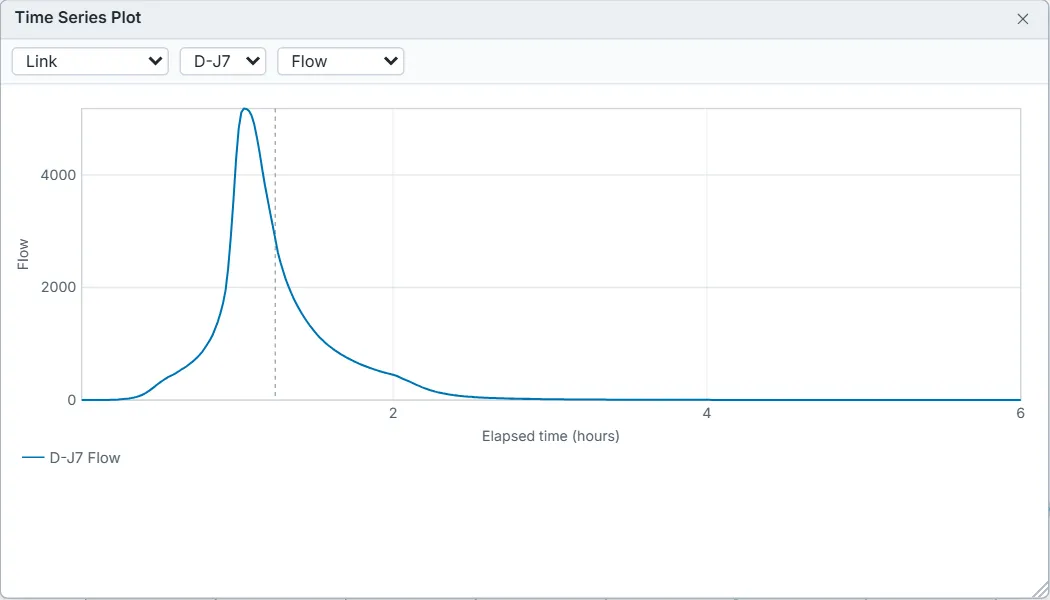
- Subcatchment, Node, Link or System, then the object and the variable.
- System variables cover the whole model, for example precipitation, runoff, total inflow, flooding, outflow and storage.
You can open several plot windows side by side. SWMM only writes results for the objects named in the model's [REPORT] section; for any other object the plot says there are no results.
Profile plot
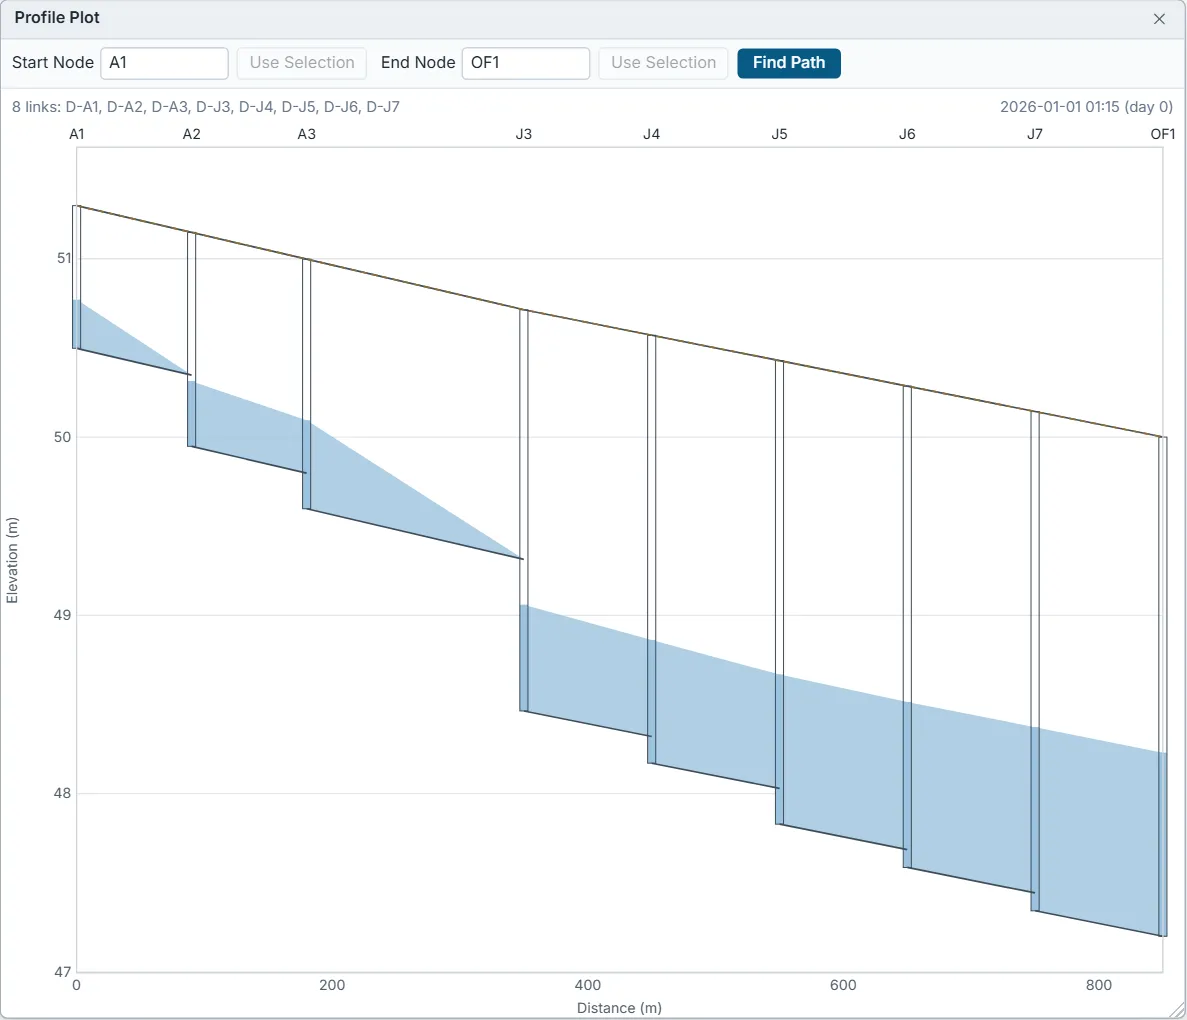
- Open Report > Profile Plot... (or the Profile Plot toolbar button).
- Type the Start Node and End Node, or click a node on the map and press Use Selection beside either box.
- Press Find Path (or Enter). DrainPilot looks for a path following the link directions first, then one ignoring them, and lists the links it found.
The plot shows the ground line (dashed), the invert and crown of each link, the manholes, and after a run the water surface at the reporting period shown on the map, so it animates with the Animator. If the model has saved profiles, a Saved profiles... list picks one. If no path joins the two nodes the window says so.
Query the map
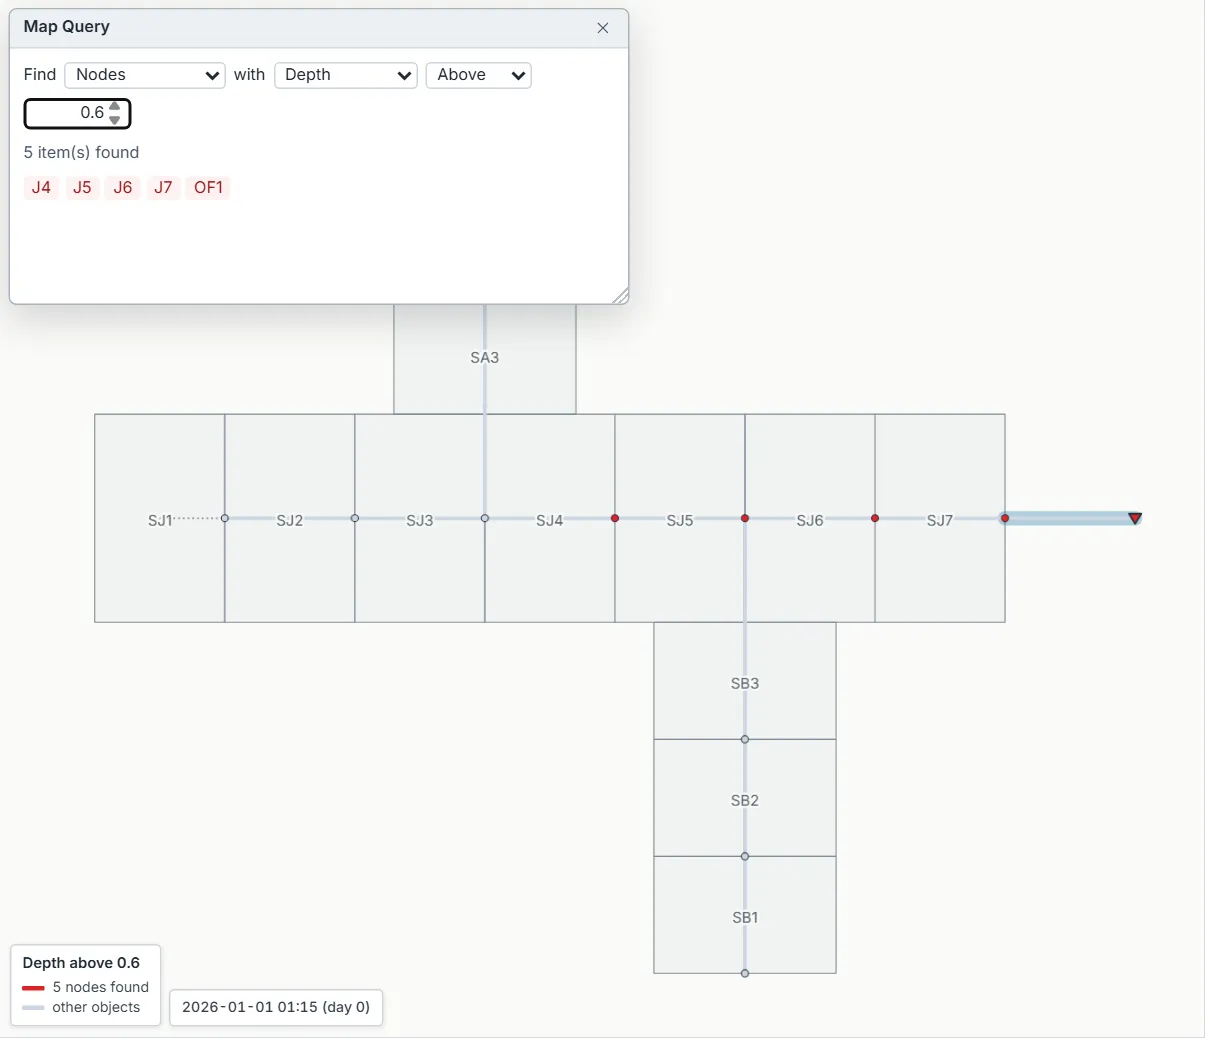
View > Query... finds objects by value: Find Subcatchments, Nodes or Links with a variable Below, Equal To or Above a number. Matches turn red on the map and everything else grey, the window counts them, and up to 60 matching IDs are listed as buttons that centre the map on the object. Computed variables are read at the reporting period shown. Closing the window puts the map colours back.
Summary tables
SWMM's own result tables (subcatchment runoff, node depth, node inflow, flooding, surcharge, outfall loading, link flow and more) are in the status report, Report > Status. Report > Summary lists how many objects of each kind the project has, its flow units, infiltration and routing methods, and start and end dates. To take results to a spreadsheet, export them as CSV: see Import and export.