
The workspace
The menus, toolbar, Project Browser, Study Area Map, Property Editor, status bar and child windows, laid out like EPA SWMM 5.2.
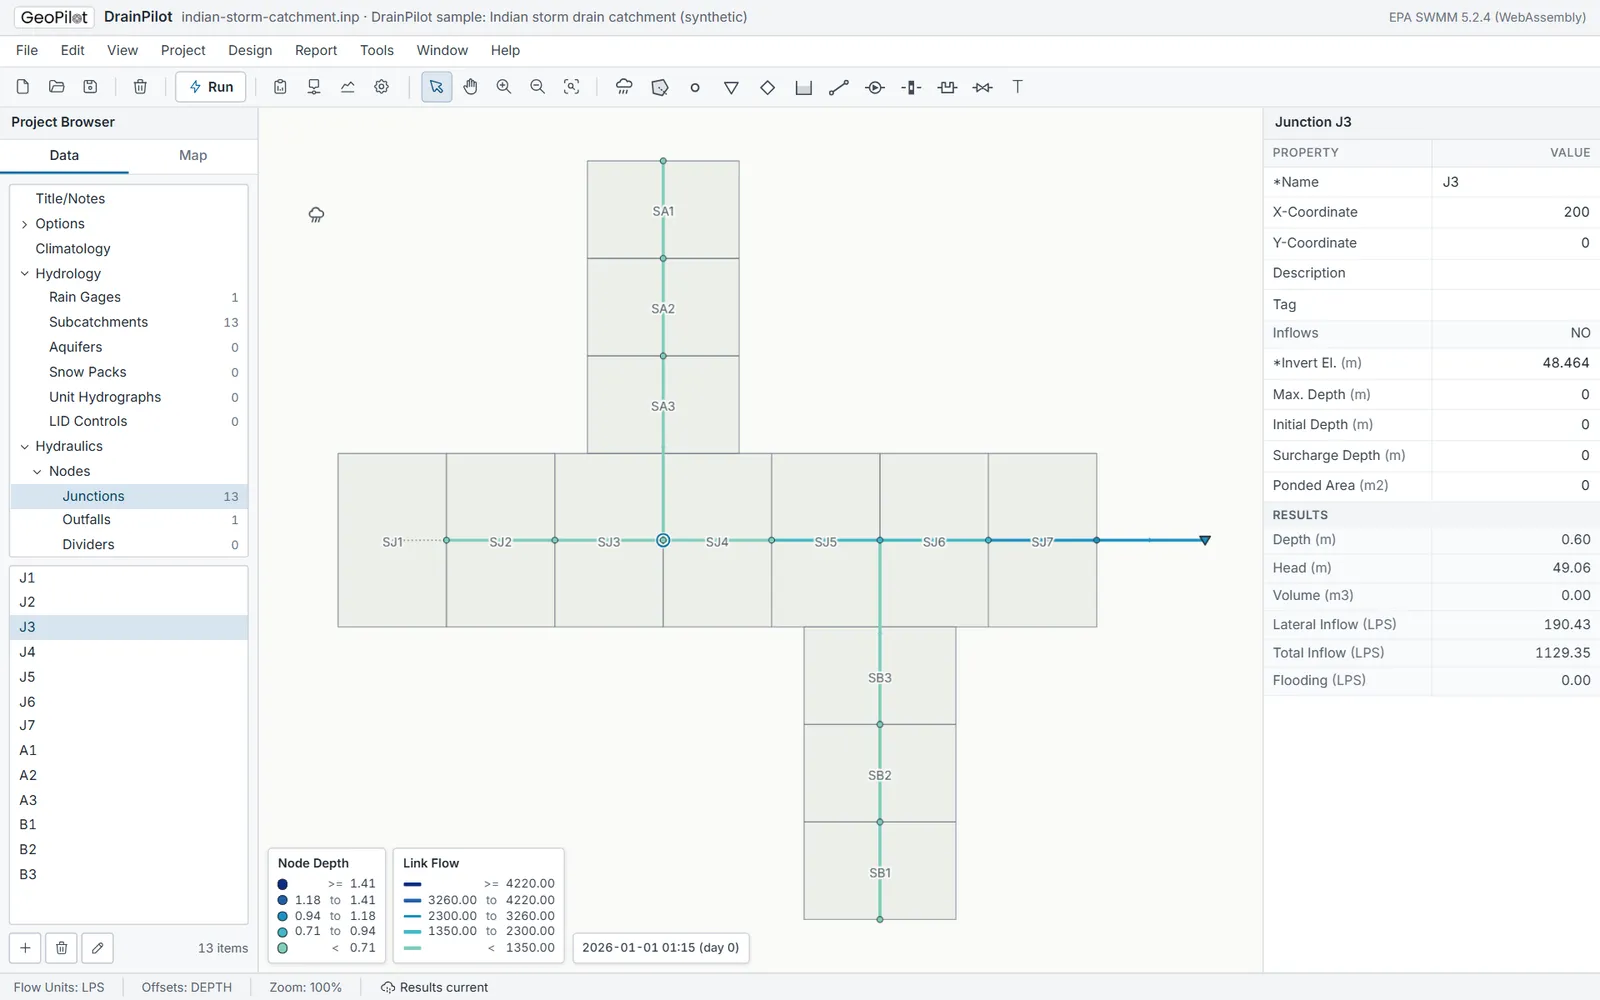
The workspace follows the layout of the EPA SWMM 5.2 desktop program, so a SWMM user finds things where they expect. From top to bottom: the title bar, the menu bar, the toolbar, then three columns (the Project Browser on the left, the Study Area Map in the middle, the Property Editor on the right), and the status bar at the bottom.
The title bar
It shows the open file name, followed by a * when there are edits since the file was opened, and the first line of the project title. At the right it names the engine: EPA SWMM 5.2.4 (WebAssembly) once a run has loaded it.
The menus
| Menu | What is on it |
|---|---|
| File | New (SI or US units), Open, the Start / Examples gallery, samples, Restore Autosave, Save, Attach Data Files, Export Results, Import Survey, Export CAD (DXF), Print. |
| Edit | Undo and Redo (Ctrl+Z, Ctrl+Y), Select Object, Delete (Del). |
| View | Pan, zoom, Full Extent, Query, Raster Layers, which labels and symbols the map shows, and the text size. |
| Project | Summary, Title/Notes, Simulation Options, Coordinate System, Control Rules, Run Simulation (F5). |
| Design | Sewer Auto-Design, Pumping Station, Sewer Compliance (CPHEEO), Storm Compliance (SWM), Design Storm / IDF, Cost Estimate (BOQ). |
| Report | Status, Summary, Problems, Results Animation, Profile Plot, Time Series Plot. |
| Tools | Survey Import, CAD Export, Catchment Delineation, LID Controls, Calibration, Scenarios, Model Check, Flood 2D, and new Time Series, Curve and Time Pattern editors. |
| Window | Close All, and every open window by name, to bring it to the front. |
| Help | This documentation, and About DrainPilot. |
A menu item shown grey is not available yet, usually because no project is open or there are no results. Edit > Undo and Edit > Redo name the edit they will undo or redo, for example Undo Add junction. Undo and Redo wait while a run is in progress.
The toolbar
Hover over any button to see its name. From left to right:

- New (an SI project, the same as File > New (SI units)), Open, Save, then Delete for the selected object.
- Run, the blue button, which runs the simulation.
- Status Report, Profile Plot, Time Series Plot and Simulation Options.
- The map tools: Select Object, Pan, Zoom In, Zoom Out and Full Extent.
- The object tools, drawn with the same symbols the map uses: Add Rain Gage, Add Subcatchment, Add Junction, Add Outfall, Add Flow Divider, Add Storage Unit, Add Conduit, Add Pump, Add Orifice, Add Weir, Add Outlet and Add Map Label. See Building a network.
The Project Browser
The Data tab lists every kind of object in the order of SWMM's browser: Title/Notes, Options, Climatology, Hydrology, Hydraulics, Quality, Curves, Time Series, Time Patterns and Map Labels, each with a count. Click a category to list its objects in the box below.
- Click an object in the list to select it on the map and show it in the Property Editor. Double-click it to centre the map on it; for a curve, time series or time pattern, double-click opens its editor.
- Add under the list starts the matching drawing tool (or, for curves, time series and patterns, opens a new editor). Delete removes the selected object and Edit does the same as a double-click.
- Selecting an object on the map moves the Browser to its category.
- Clicking an Options page or Title/Notes opens its editor window.
The Map tab chooses what the map is coloured by (subcatchments, nodes and links, each with its own list), the Time Period shown, and holds the Animator to play the run. See Viewing results.
The Study Area Map
- Scroll the mouse wheel to zoom in and out around the pointer. With Select Object active, drag on empty map to pan; Full Extent fits the whole model in view.
- With Select Object, click a node, link, subcatchment, rain gage or label to select it. Drag a node, rain gage or label to move it.
- Legends for the current colouring sit at the bottom left, with the date and time of the reporting period beside them.
- The View > Node IDs, View > Link IDs, View > Subcatchment IDs and other View items show or hide IDs, values, map labels, rain gages, subcatchment outlet lines and flow arrows. A tick marks the ones that are on.
The Property Editor
It lists the selected object's properties, one row each, in the order of Appendix B of the SWMM 5.2 manual. A * marks a required value; units are in brackets after the name. Type a new value and press Enter (or click elsewhere) to commit it; Esc puts the old value back. Grey rows under RESULTS show the last run's values at the reporting period chosen on the Map tab. Every edit can be undone.
The status bar
From left to right: Flow Units, Offsets (DEPTH or ELEVATION, how link offsets are read), the map Zoom percentage, the run status, and the X,Y coordinates under the pointer. The run status is one of No results, Running..., Results current, Results out of date and Run failed.
Child windows
Reports, editors and tools open as windows floating over the map. Drag a window by its title bar, resize it from the grip at its bottom right corner, and close it with the cross. Click a window to bring it to the front. Most tool windows open once; choosing the menu item again brings the open one forward. Window > Close All closes them all.
Text size
The last four items on the View menu set the size of everything in the workspace: Text Size: Small, Normal, Large and Extra Large. DrainPilot picks a size from your screen width the first time, and remembers your choice in this browser.